Freight - Marine
On this page:
Freight - Marine

Source: WSDOT Rail, Freight, and Ports Division.
Note: The Northwest Seaport Alliance includes the merged marine cargo operations of the ports of Seattle and Tacoma. TEU stands for "Twenty-foot equivalent unit".
Performance analysis
2022
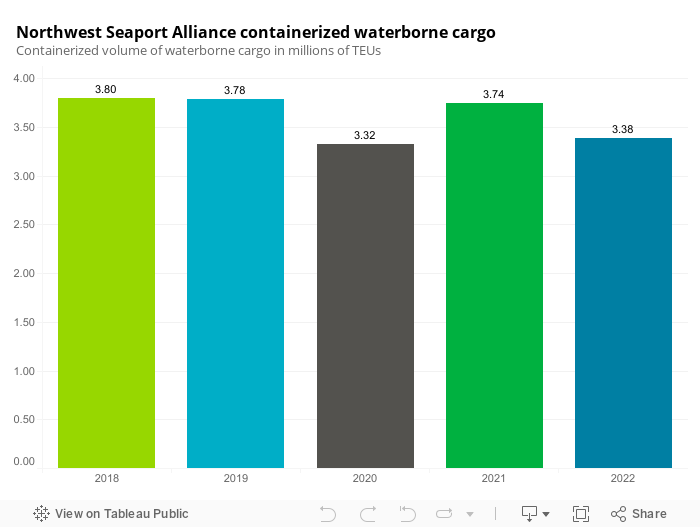
Northwest Seaport Alliance experiences a decrease in containerized waterborne cargo in 2022
Washington's two largest ports in Seattle and Tacoma, collectively known as the Northwest Seaport Alliance, handled 3.4 million 20-foot equivalent units (TEU) of containerized cargo in 2022. This was a 9.4% decrease from 3.7 million TEUs in 2021. The decrease in containerized freight moving through Washington's largest ports is attributed to several factors, including:
- Monetary exchange rate changes that benefit imports over exports
- Ongoing tariffs in key markets, and
- Outbound sailings that are returning to overseas ports without cargo to reduce travel times and more quickly return with imports, rather than carrying exports from the United States.
2021
Northwest Seaport Alliance sees an increase in containerized waterborne cargo in 2021
In 2021, the Northwest Seaport Alliance (which includes the merged marine cargo operations from the ports of Seattle and Tacoma) handled 3.74 million 20-foot equivalent units of containerized cargo.
This was a 12.5% increase from 3.32 million TEUs in 2020. This increase in containerized freight moving through Washington's largest ports is indicative of the slowly recovering economy.
Approximately 73% of waterborne freight shipped in Washington in 2021 was categorized as foreign.
In 2021, the most recent data available, approximately 116.8 million tons of waterborne freight were shipped in Washington, up 6.5% from 109.7 million tons in 2020. Waterborne freight is categorized as foreign, domestic, or intrastate (with both origin and destination in Washington).
International exports comprised 56% of waterborne freight in 2021 and 16.6% were international imports. Domestic shipments accounted for 20.6% and the remaining 6.8% was intrastate freight. Foreign freight activity increased 6.1% from 79.9 million tons in 2020 to 84.7 million tons in 2021.
Domestic freight activity increased 12.6% from 21.4 million tons in 2020 to 24.1 million tons in 2021. Intrastate freight activity decreased 4.8% from 8.4 million tons to 8.0 million tons.
The top commodities shipped to, from and within Washington state by water included food and food products (such as grain, oilseeds, and other agricultural products). Petroleum products made up 11.6% and crude petroleum comprised 10.5% of shipments. Between 2020 and 2021, the quantities of both petroleum products and crude petroleum shipped increased by 7.6% and 33.8%, respectively. Food-related products increased by less than 1% over the same period.
2020
Northwest Seaport Alliance sees a decrease in containerized waterborne cargo in 2020
In 2020, the Northwest Seaport Alliance (which includes the merged marine cargo operations from the ports of Seattle and Tacoma) handled 3.32 million 20-foot equivalent units of containerized cargo. This was a 12.2% drop from 3.78 million TEUs in 2019. This decline in containerized freight volume at these ports—the largest in Washington state—was primarily due to the disruptions in normal shipping activity caused by the COVID-19 pandemic, as well as the continuing tariff war with China.
Approximately 73% of waterborne freight shipped in Washington in 2020 was categorized as foreign
Domestic freight activity decreased 10.6% from 23.9 million tons in 2019 to 21.4 million tons in 2020, while intrastate freight activity increased 0.9% from 8.3 million tons to 8.4 million tons (refer to chart below).
The top commodities shipped to, from and within Washington state by water include food and food products (such as grain, oilseeds and other agricultural products).
Petroleum products made up 11.5% and crude petroleum comprised 8.3% of shipments. Between 2019 and 2020, the quantities of both petroleum products and crude petroleum shipped decreased by 17.5% and 26.8%, respectively. Food/ kindred products increased by 10.2% over the same period.
2019
Ports of Seattle and Tacoma see a small decrease in containerized waterborne cargo in 2019
In 2019, the ports of Seattle and Tacoma (which merged their marine cargo operations into the Northwest Seaport Alliance in 2015) handled a combined 3.78 million 20-foot equivalent units of containerized cargo—a 0.6% drop from 3.80 million TEUs in 2018. This decline in containerized freight volume was the first these ports had experienced since 2014, and is primarily attributed to the ongoing tariffs on trade with China.
The ports of Seattle and Tacoma, which are by far the largest ports in Washington state, handled an average of 3.68 million TEUs of freight each year from 2015 through 2019. Despite the decline in freight volume in 2019, this average remains higher than the 2014-2018 average, because these ports handled more freight in 2019 than in 2014.
Over 71% of waterborne freight shipped in Washington in 2019 was categorized as foreign
In 2019, approximately 112.4 million tons of waterborne freight were shipped in Washington, down 9.5% from 124.2 million tons in 2018. This decrease in waterborne freight activity was due primarily to declines in international exports of food and food products, and in international imports of petroleum.
Waterborne freight is categorized as foreign, domestic or intrastate (with both origin and destination in Washington). In 2019, 55% of waterborne freight was international export and 16.3% was international import. Domestic shipment accounted for 21.3% and the remaining 7.4% was intrastate freight.
Foreign freight activity decreased 11.6% from 90.6 million tons in 2018 to 80.1 million tons in 2019. Domestic freight activity decreased 6.1% from 25.4 million tons in 2018 to 23.9 million tons in 2019, while intrastate freight activity increased 2.3% from 8.15 million tons to 8.34 million tons.
The top commodities shipped to, from and within Washington state by water include food and food products (such as grain, oilseeds and other agricultural products), petroleum products and crude petroleum. In 2019, food and food products comprised 40.0% of the state's total waterborne freight shipped, which was mostly exported to foreign markets. Petroleum products made up 13.6% and crude petroleum comprised 11.1%. The quantities of both food/food products and petroleum products shipped decreased from 2018 to 2019 by 11.1% and 1.8%, respectively. Crude petroleum deceased by 9.0% over the same period.
2018
Nearly 73% of waterborne freight shipped in Washington in 2018 was categorized as foreign
In 2018, approximately 124.2 million tons of waterborne freight were shipped in Washington, up 4.0% from 119.4 million tons in 2017
Waterborne freight is categorized as foreign, domestic or intrastate (with both origin and destination in Washington). In 2018, 72.9% of waterborne freight was foreign, 20.5% was domestic and 6.6% was intrastate. Foreign freight activity increased—going from 84.1 million tons in 2017 to 90.6 million tons in 2018—while both domestic and intrastate freight activity decreased slightly. The increase in foreign waterborne freight activity was due to increases in food exported from Washington as well as increases in crude petroleum and petroleum products imported into the state.
The top commodities shipped to, from and within Washington state by water include food and food products (such as grain, oilseeds and other agricultural products), petroleum products and lumber products. In 2018, food and food products comprised 40.7% of the state's total waterborne freight shipped, petroleum products made up 12.5% and lumber products comprised 6.2%. The quantities of both food/food products and petroleum products shipped increased from 2017 to 2018 by 7.9% and 7.8%, respectively. Lumber products deceased by 16.5% over the same period.
Seattle and Tacoma see an increase in waterborne freight in 2018
The ports of Seattle and Tacoma, which merged their marine cargo operations into the Northwest Seaport Alliance in 2015, saw a combined 2.6% increase in containerized waterborne freight in 2018.
Containerized port freight is measured by 20-foot equivalent units (TEU), which represent the freight in one 20-foot marine cargo container. These containers carry many different types of freight and come in different lengths; for example a 40-foot container is equal to two TEUs. In 2018, the ports of Seattle and Tacoma—by far the largest ports in the state—handled a combined 3.8 million TEUs of cargo, up 2.6% from 3.7 million in 2017. The five-year TEU average for the two ports is 3.6 million TEU, up from the previous five-year average of 3.5 million. The TEU average for the ports of Seattle and Tacoma and has increased every year since 2015.