Pavement - Conditions & performance
On this page:
Pavement performance measures
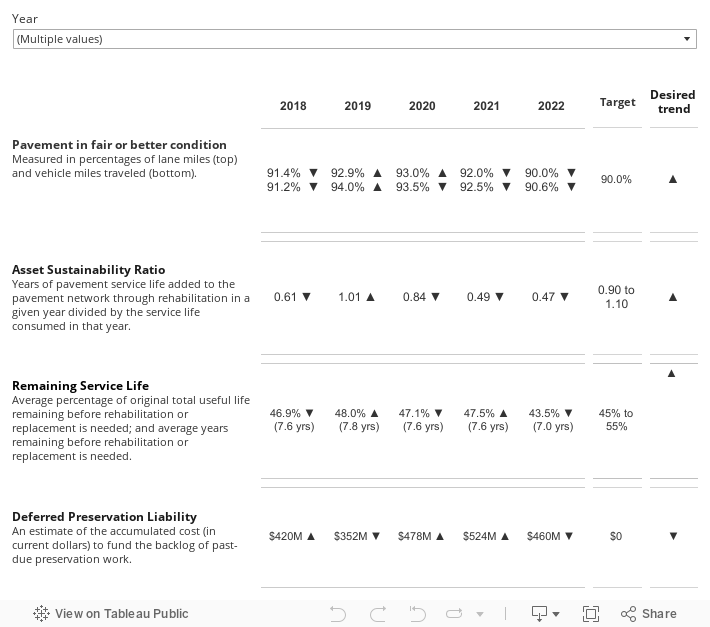
Source: WSDOT Pavement Office.
Notes: Fair or better percentages were slightly affected in 2020 by COVID-19 impacts on data collection. When pavement condition is weighted by vehicle miles traveled (VMT), roadways with more traffic are weighted more heavily than less traveled roads. Weighting pavement condition by VMT better accounts for the higher costs to maintain and preserve roads with more traffic. Measures for pavement in fair or better condition, Asset Sustainability Ratio and Remaining Service life are also weighted by vehicle miles traveled to better capture the typical road user's experience.
Performance analysis
2022
Pavement in fair or better condition declines statewide
The condition of WSDOT-managed pavement lane miles in fair or better condition worsened 2.0 percentage points from 92.0% in 2021 to 90.0% in 2022.
WSDOT collects imagery, rutting depths, and International Roughness Index values annually using a specialized vehicle in the Pavement Management Unit. The imagery data is analyzed and deteriorated pavement locations are classified by type, severity, and extent. The rated images are assigned a numerical value based on the severity and extent of the deterioration (distresses) seen and rated. These numerical values are translated into "good," "fair," "poor" and "very poor." This map provides an in depth, interactive look at these conditions on highways statewide.
Vehicle Miles Traveled is a widely used and significant measurement in traffic engineering. The U.S. Department of Transportation defines VMT as the total annual miles of vehicle travel divided by the total population in a state or in an urbanized area. In Washington, 90.6% of VMT was driven on pavement in fair or better condition in 2022, down 1.9 percentage points from 92.5% in 2021.
When VMT is considered for pavement condition measures, roadways with higher traffic volumes that must perform to higher standards are given more weight in calculations than less-traveled roads. As a result, the statewide pavement (fair or better) condition is higher when measured via vehicle miles traveled; 90.6% for VMT compared to 90.0% for lane miles.
WSDOT ensures pavement preservation on interstates takes priority over other roadways due to FHWA requirements. The emphasis on these more-traveled strategic freight corridors is one reason the state did not experience a larger decrease in the percentage of VMT-weighted pavement in fair or better condition between 2021 and 2022.
WSDOT pavement condition projected to miss goal
Pavement does not deteriorate in a linear trend over timeand once it transitions from good to fair condition, preservation treatments are the stopgap to prevent rapid pavement deterioration.
The diagram shows pavement conditions drop rapidly below fair, which is why this condition is a typical trigger point to apply a preservation treatment and prevent rapid deterioration. If a preservation treatment is not applied soon after pavement reaches fair condition, rehabilitation—which is much more costly—quickly becomes necessary. After that, the pavement requires reconstruction.
An example of a typical pavement deterioration curve:

2021
WSDOT pavement conditions worsen in 2021, preservation funding issues continue
The condition of WSDOT-managed pavement lane miles in fair or better condition worsened from 93.0% in 2020 to 92.0% in 2021. Due to COVID-19 restrictions, chip seal roadways were not included in 2020 data, but they were included in the 2021 analysis.
Weighted by the amount of traffic carried, 92.5% of vehicle miles traveled (VMT) in 2021 were driven on pavement in fair or better condition, down 1.0 percentage point from 93.5% in 2020.
When VMT is considered in pavement condition measures, roadways with higher traffic volumes and that must perform to higher standards are given additional weight in calculations than less-traveled roads. As a result, the pavement condition is higher when measured via vehicle miles traveled; 92.5% for VMT compared to 92.0% for lane miles. WSDOT ensures interstate pavement preservation takes priority over other roadways due to Federal Highway Administration Transportation Performance Management requirements. The emphasis on these more-traveled strategic freight corridors (also known as T-1 and T-2 corridors) is one reason the state did not experience a larger decrease in the percentage of VMT-weighted pavement in fair or better condition between 2020 and 2021.
Lowest cost pavement rehabilitation should occur at fair condition
WSDOT prefers to begin the rehabilitation process to protect the pavement structure and manage pavement at the lowest life-cycle cost when it is in fair condition. The condition of WSDOT-managed roadways is evaluated annually using three indicators:
- Surface cracking (an indicator of structural deterioration);
- Rutting (which is monitored for safety and structural reasons); and
- Roughness (measured using the International Roughness Index.
WSDOT uses these criteria to classify pavement conditions into four categories: good/very good, fair, poor and very poor.
The good, fair, poor indicators are useful for short-term evaluations of current conditions but do not provide information about past performance or forecasted future performance. Long-term performance indicators provide a more in-depth assessment of pavement infrastructure, as they account for the impact funding has on asset sustainability, pavement service life and preservation backlog.
2020
WSDOT pavement conditions improve slightly in 2020, preservation funding issues continue
The condition of WSDOT-managed pavement lane miles in fair or better condition improved slightly from 92.9% in 2019 (not including chip seal roadways) to 93.0% in 2020. Weighted by the amount of traffic carried, 93.5% of vehicle miles traveled (VMT) in 2020 were driven on pavement in fair or better condition, down 0.6 percentage points from 94.1% in 2019.
When VMT is considered in pavement condition measures, roadways with higher traffic volumes are given additional weight in calculations than less-traveled roads. As a result, the pavement condition is higher when measured via vehicle miles traveled; 93.5% for VMT compared to 93.0% for lane miles.
Lowest cost pavement rehabilitation should occur at fair condition
WSDOT prefers to begin the rehabilitation process to protect the pavement structure and manage the pavement at the lowest life-cycle cost when pavement is in fair condition. The condition of WSDOT-managed roadways is evaluated annually using three indicators:
- Surface cracking (an indicator of structural deterioration);
- Rutting (which is monitored for safety and structural reasons); and
- Roughness (measured using the International Roughness Index, or IRI).
WSDOT uses these criteria to classify pavement conditions into five categories: very good, good, fair, poor and very poor. The good, fair, poor indicators are useful for short-term evaluations of current conditions but do not provide information about past performance or forecasted future performance. Long-term performance indicators provide a more in-depth assessment of pavement infrastructure, as they account for the impact funding has on asset sustainability, pavement service life and preservation backlog.
2019
Pavement conditions improve between 2018 and 2019
In 2019, 93.2% of all WSDOT-managed pavement lane miles were in fair or better condition, up from 91.4%in 2018. Several multi-year concrete paving projects became substantially complete in 2019, which contributed to the improvement, as did the inclusion of data on the condition of chip seal pavement for the first time in several years. Annual condition data on chip seal pavement was either not collected or not analyzed from 2010 through 2018 due to continuous budget cuts.
The agency evaluates the condition of asphalt and concrete pavement on state-owned roadways annually using three indicators: surface cracking (an indicator of structural deterioration); rutting (which is monitored for safety and structural reasons); and smoothness (measured using the International Roughness Index). These criteria are used to classify pavement conditions into four categories: good/very good, fair, poor and very poor.
2018
Pavement conditions decline for fourth consecutive year
In 2018, 91.4% of WSDOT-managed pavement lane miles were in fair or better condition, down from 91.8% in 2017. Although the agency continued to meet its goal of having at least 90% of pavement lane miles in fair or better condition, 2018 was the fourth year in a row of declining conditions.
The agency evaluates the condition of asphalt and concrete pavement on state-owned roadways annually using three indicators: surface cracking (an indicator of structural deterioration); rutting (which is monitored for safety and structural reasons); and smoothness (measured using the International Roughness Index). These criteria are used to classify pavement conditions into four categories: good/very good, fair, poor and very poor.
Lowest cost pavement rehabilitation should occur at fair condition
WSDOT prefers to begin the rehabilitation process to protect the pavement structure and manage the pavement at the lowest life-cycle cost when pavement is in fair condition. The condition of WSDOT-managed roadways is evaluated annually using three indicators:
- Surface cracking (an indicator of structural deterioration);
- Rutting (which is monitored for safety and structural reasons); and
- Roughness (measured using the International Roughness Index, or IRI).
WSDOT uses these criteria to classify pavement conditions into five categories: very good, good, fair, poor and very poor. The good, fair, poor indicators are useful for short-term evaluations of current conditions but do not provide information about past performance or forecasted future performance. Long-term performance indicators provide a more in-depth assessment of pavement infrastructure, as they account for the impact funding has on asset sustainability, pavement service life and preservation backlog